Platform
The measurement platform behind every KASPR product.
KASPR Datahaus operates its own global internet measurement infrastructure. Everything we offer, from Pulse dashboards to Sense timing decisions to developer access, draws on the same longitudinal data asset and the same analytical and forecasting models.
Data infrastructure
A record of the internet, not a snapshot
Most connectivity data comes from app-based speed tests or isolated probes. KASPR scans remotely and consistently, so the record is comparable over time and across places, and large enough to learn what normal looks like everywhere.
data points
7.5T
Hourly measurements collected by KASPR's proprietary scanning infrastructure.
countries monitored
130+
Coverage at country, region and district level, with subnational resolution where measurement density allows.
endpoints measured
400M+
Internet endpoints probed every day across fixed and mobile networks, producing 3.5 billion observations a day.
continuous scanning since
since 2019
Uninterrupted global measurement since February 2019, so every forecast is grounded in years of comparable history.
Remote, consistent measurement
No apps, agents or software installed on user devices. The same measurement method is applied to every location every hour, and the approach is privacy-preserving by design.
Hourly, since February 2019
Continuous scanning gives an unbroken hourly series for every measured place, which is what makes forecasting and anomaly detection possible.
Analytics-ready
Latency, availability and jitter are aggregated to country, region and district, ready to join with your own geography, assets or audiences.
Measurement and coverage
Global reach, subnational resolution
Countries
130+ countries monitored continuously, covering most of the world's connected population.
Regions and districts
Measurements are aggregated to administrative regions and districts, giving a local view where it exists and an honest gap where it does not.
Endpoints
Over 400 million endpoints are measured, producing billions of observations a day.
Figures are rounded and conservative. Exact district and country counts for a given data vintage are stated in the product documentation.
Measurement. KASPR's infrastructure sends lightweight network probes to a large, geographically distributed set of internet endpoints every hour. For each endpoint we record whether it responds and how long the round trip takes. Nothing is installed on the measured devices, and no content is read.
Aggregation. Individual responses are aggregated to the country, region and district the endpoint sits in, producing hourly indicators of availability (how many endpoints respond), latency (how long responses take) and jitter (how much latency varies). Aggregation protects privacy and makes places comparable.
Baselines and anomalies. Because every place has an hourly history going back years, KASPR knows what is normal for that place at that hour of the week. Departures from that baseline, such as an outage or a latency surge, are detected as anomaly episodes and, where they cross validation thresholds, surfaced as alerts.
Differential analysis. Comparing a specific facility, district or provider with its surroundings separates a targeted impact from a regional or systemic event. This is the method behind our conflict, disaster and infrastructure case studies.
The data records timing and depth of change, not cause. The methodology factsheet and the data documentation describe variables, coverage and limitations in detail.
Forecasting
Predicting network conditions, not just reporting them
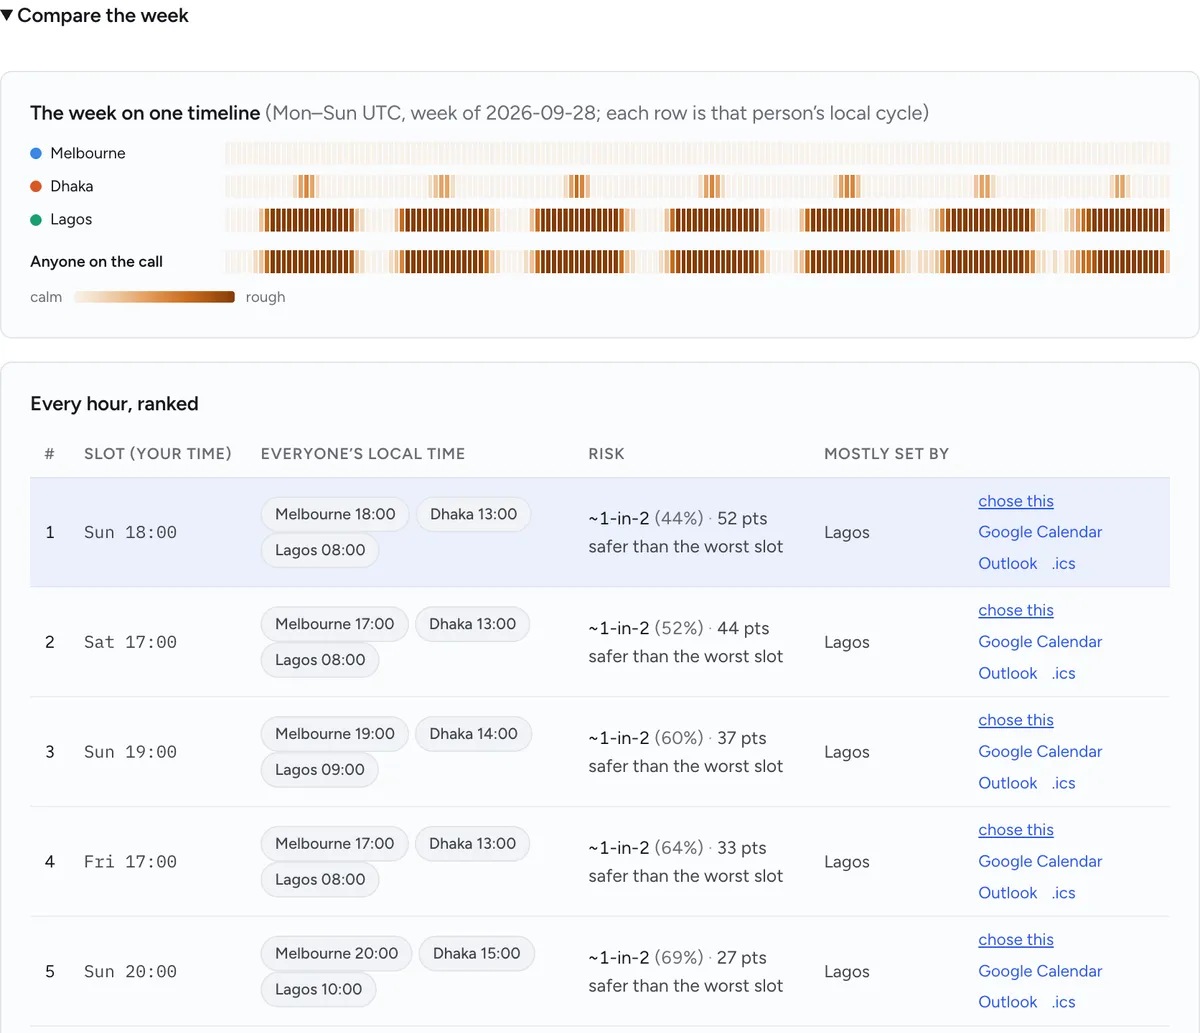
Machine learning models trained on years of hourly history forecast typical conditions for the hours ahead for every measured place. Pulse uses these forecasts to warn which districts are likely to be rough next week. Sense turns them into timing recommendations for calls, launches and automated jobs. Forecasts describe typical patterns and likelihoods, not certainties, and are always shown with the history they come from.
Company
About KASPR Datahaus
KASPR Datahaus is a Monash University spin-out founded by researchers in computer science, complex systems, data science and economics. Our mission is to map and forecast global digital infrastructure every day and make the complexity of the internet understandable, visible and actionable.
About
Mission, history and the KASPR advantage.
Team
The founders and leadership team.
Social good
The Monash IP Observatory and human-rights monitoring.
Partners
Distribution partners and research collaborators.
Media coverage
KASPR data in the news.
Blog and case studies
Analysis and applied examples.
Want the data itself?
Developers and data teams can reach the platform through the KASPR Data MCP, marketplace listings and enterprise licensing.
Or email info@kasprdata.com