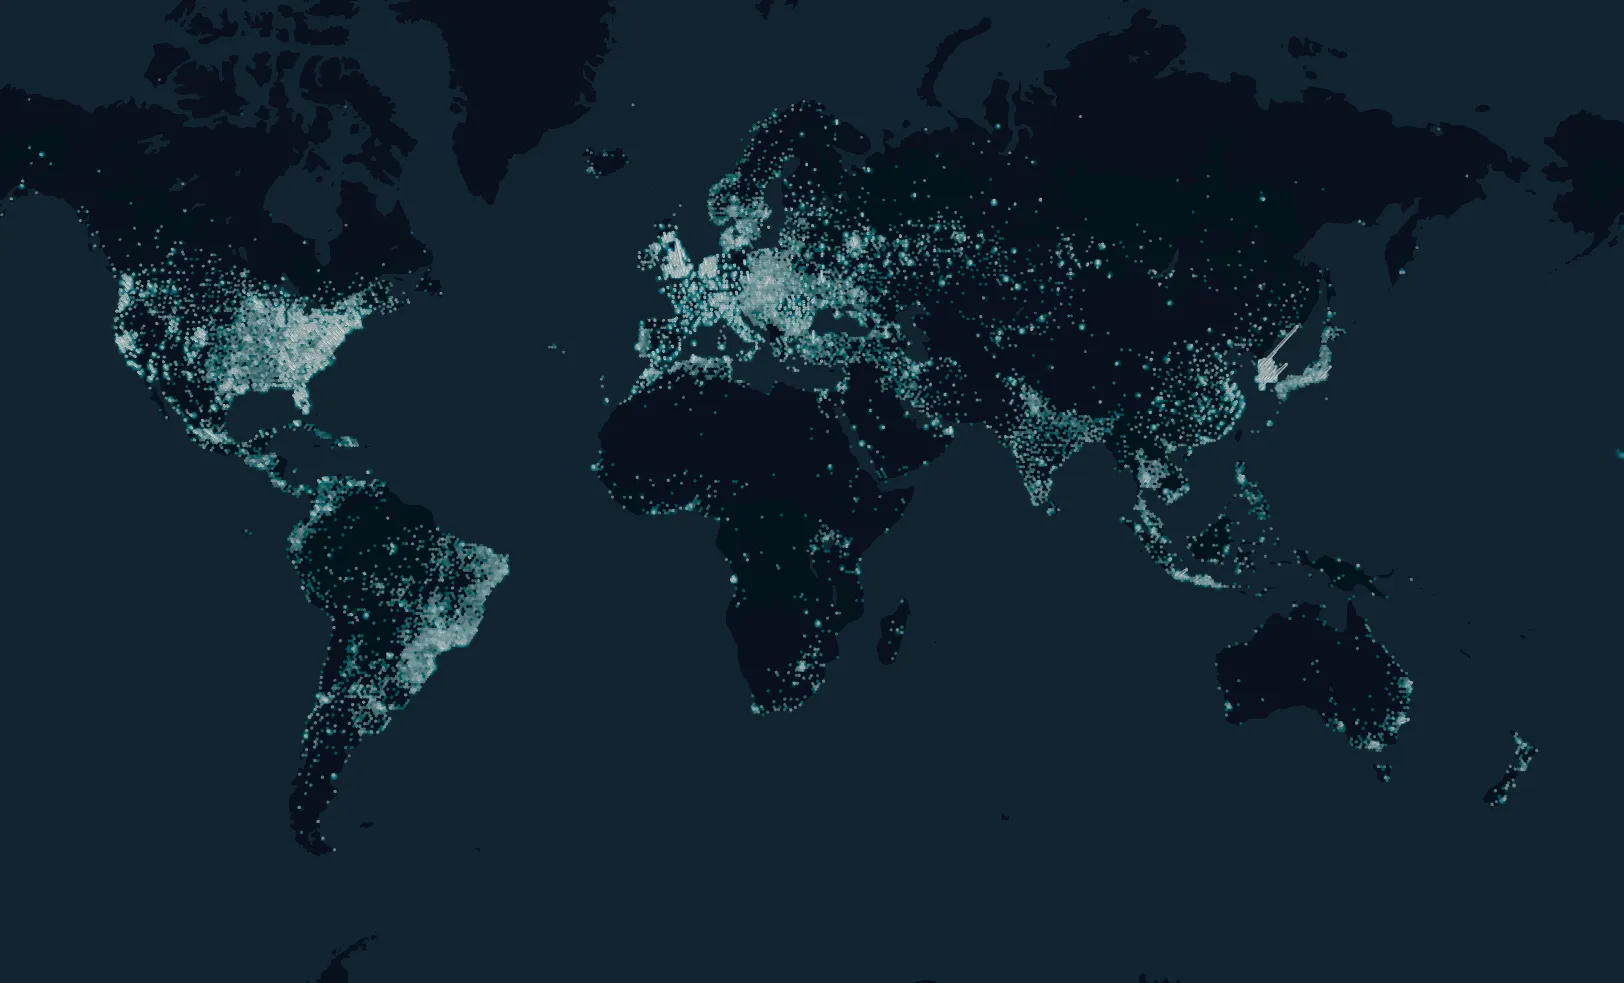
On Thursday 12 November, Microsoft 365 went down for users around the world. Outlook, Teams, SharePoint and Copilot were out of reach for hours, and reports on Downdetector peaked at around 130,000 for Outlook alone.
The way the outage unfolded is the instructive part. Microsoft first reported unusually high load on part of its infrastructure. It then said the load was not extra traffic. Servers had dropped out of service, and the ones still running were carrying their work. The company moved traffic to other parts of its worldwide infrastructure, paused all deployments and restarted servers. Several hours in, it said its actions “have not provided the anticipated relief”.
This is what a cascade looks like. One part fails, its load moves elsewhere, and the parts that receive it start to struggle too. The usual response, sending traffic to healthy infrastructure, did not fix it. Engineers at one of the best-resourced technology companies in the world had to work out what was happening live, in production, with customers watching.
Other industries rehearse
Aircraft makers, power grid operators and flood planners do not wait for the real event to find out how their systems behave under stress. They build a model and break it first.
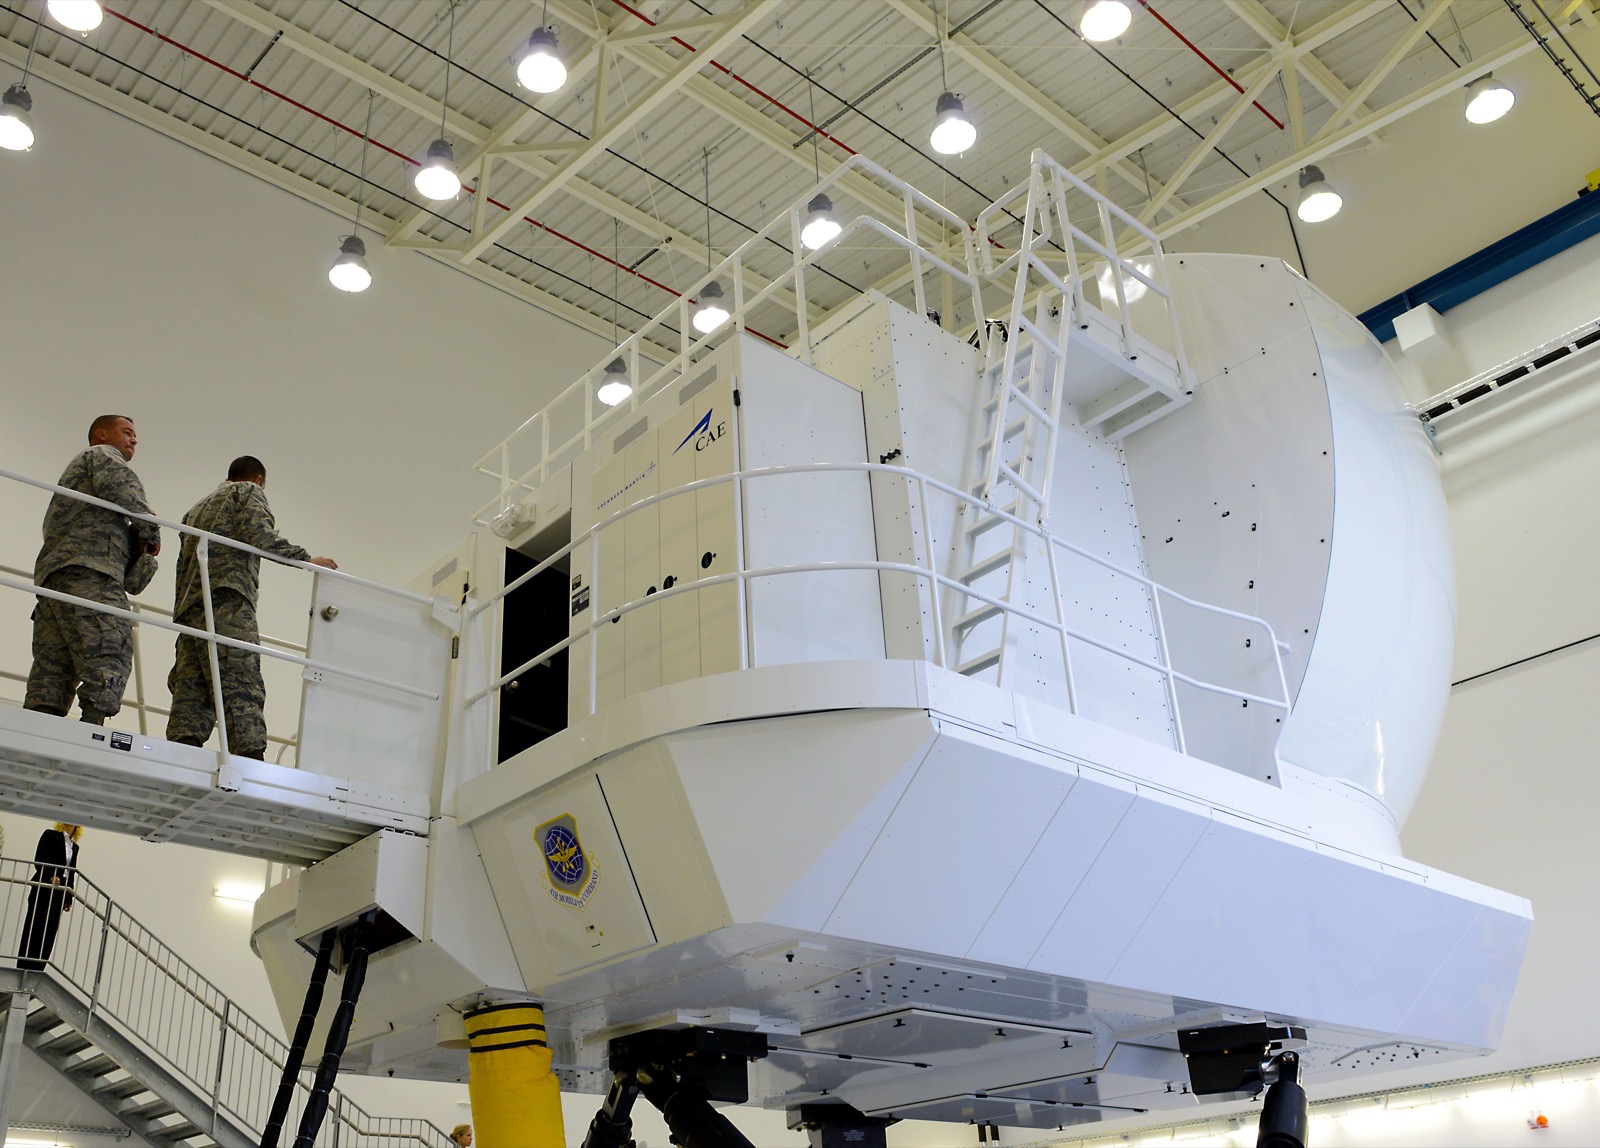 A C-130J full flight simulator at Ramstein Air Base, 2015. Crews practise failures here that they must never meet for the first time in the air. U.S. Air Force photo by Senior Airman Timothy Moore, public domain, via Wikimedia Commons.
A digital twin is a working model of a real system, fed with real data, on which you can try things you would never try on the system itself. A world model is the wider term from AI research. It is a model that has learned how an environment behaves well enough to predict what happens next.
For networks, the questions such a model should answer are practical. If this site, cable or region fails, where does the traffic go? Which places slow down as a result? How long does recovery take? Which customers, branches or insured companies are hit at the same time?
The answers matter for planning, such as where to add capacity or a backup route. They matter for risk management, where the questions are how large a loss could be, how often it could happen and how many exposures fail together.
The telecom industry is already moving this way. In August 2026 Ericsson published a white paper on telecom foundation world models. It describes them as models that predict how a network will respond to a chosen action, so that a change can be tested before it reaches the live network. Amdocs describes the network digital twin as a risk-free sandbox in which operators test configurations and simulate scenarios, and it has made a network operations digital twin a layer of its agentic operating system.
A model needs a record of the real world
A model built on assumptions about normal conditions tells you about the assumptions. To be useful it needs two things from the real world.
The first is a baseline: how the network in each place actually behaves, hour by hour, when nothing is wrong. The second is a history of past failures and recoveries, so the model’s output can be checked against what really happened.
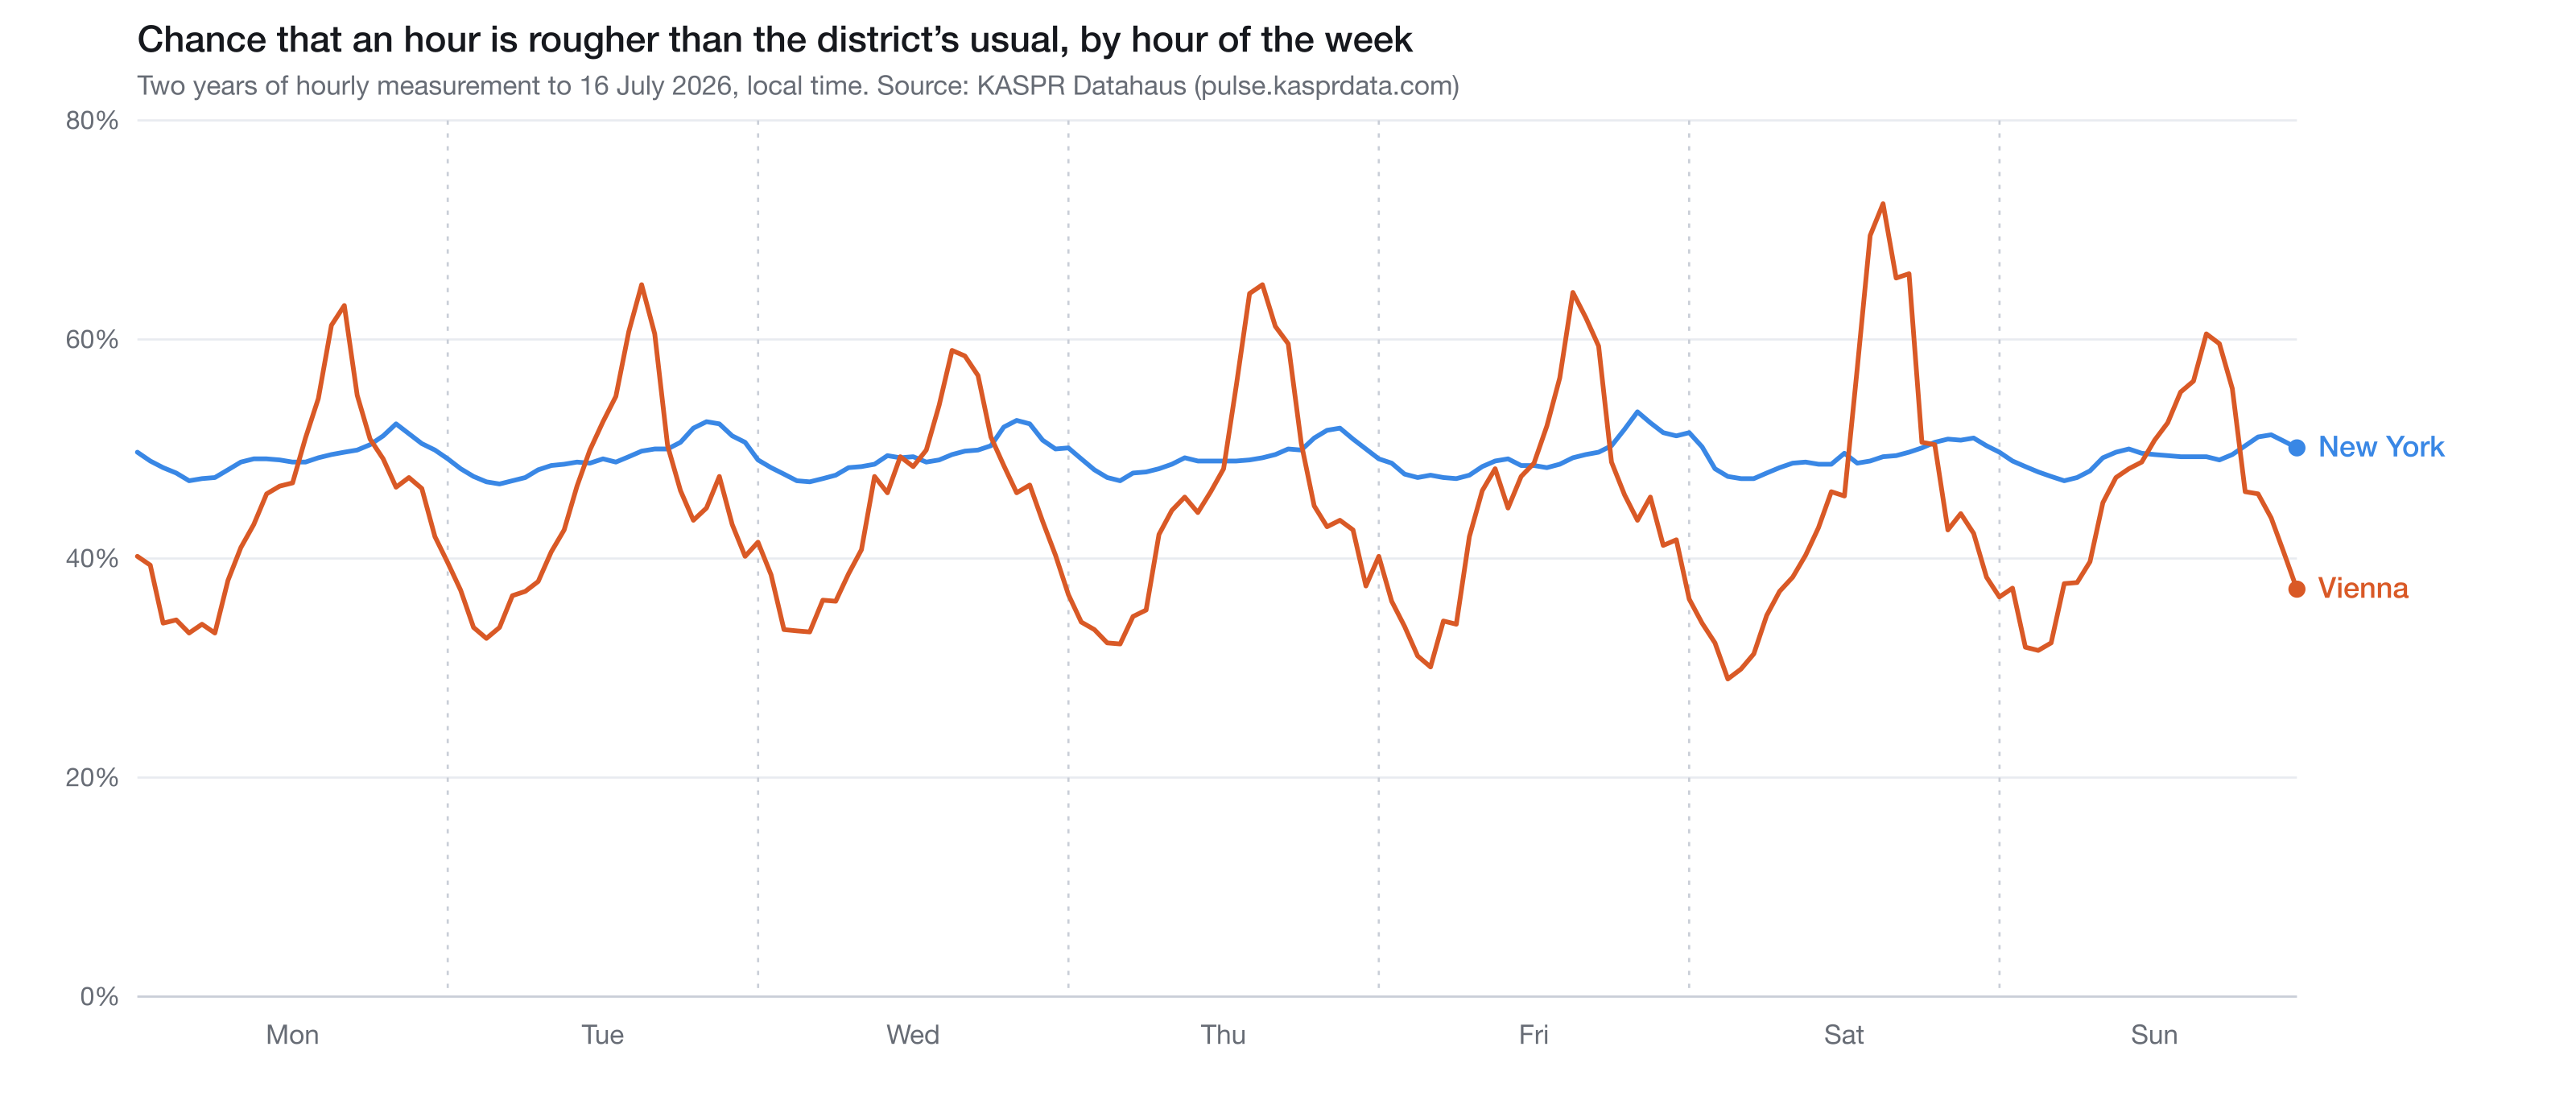 Figure 1. What a baseline looks like. For every measured district, KASPR holds the chance that a given hour of the week is rougher than the district’s usual, from two years of hourly measurement. New York is almost flat; Vienna has a strong evening peak every day. A model that assumes one shape for both is wrong about at least one of them. Source: KASPR Datahaus, data vintage 16 July 2026.
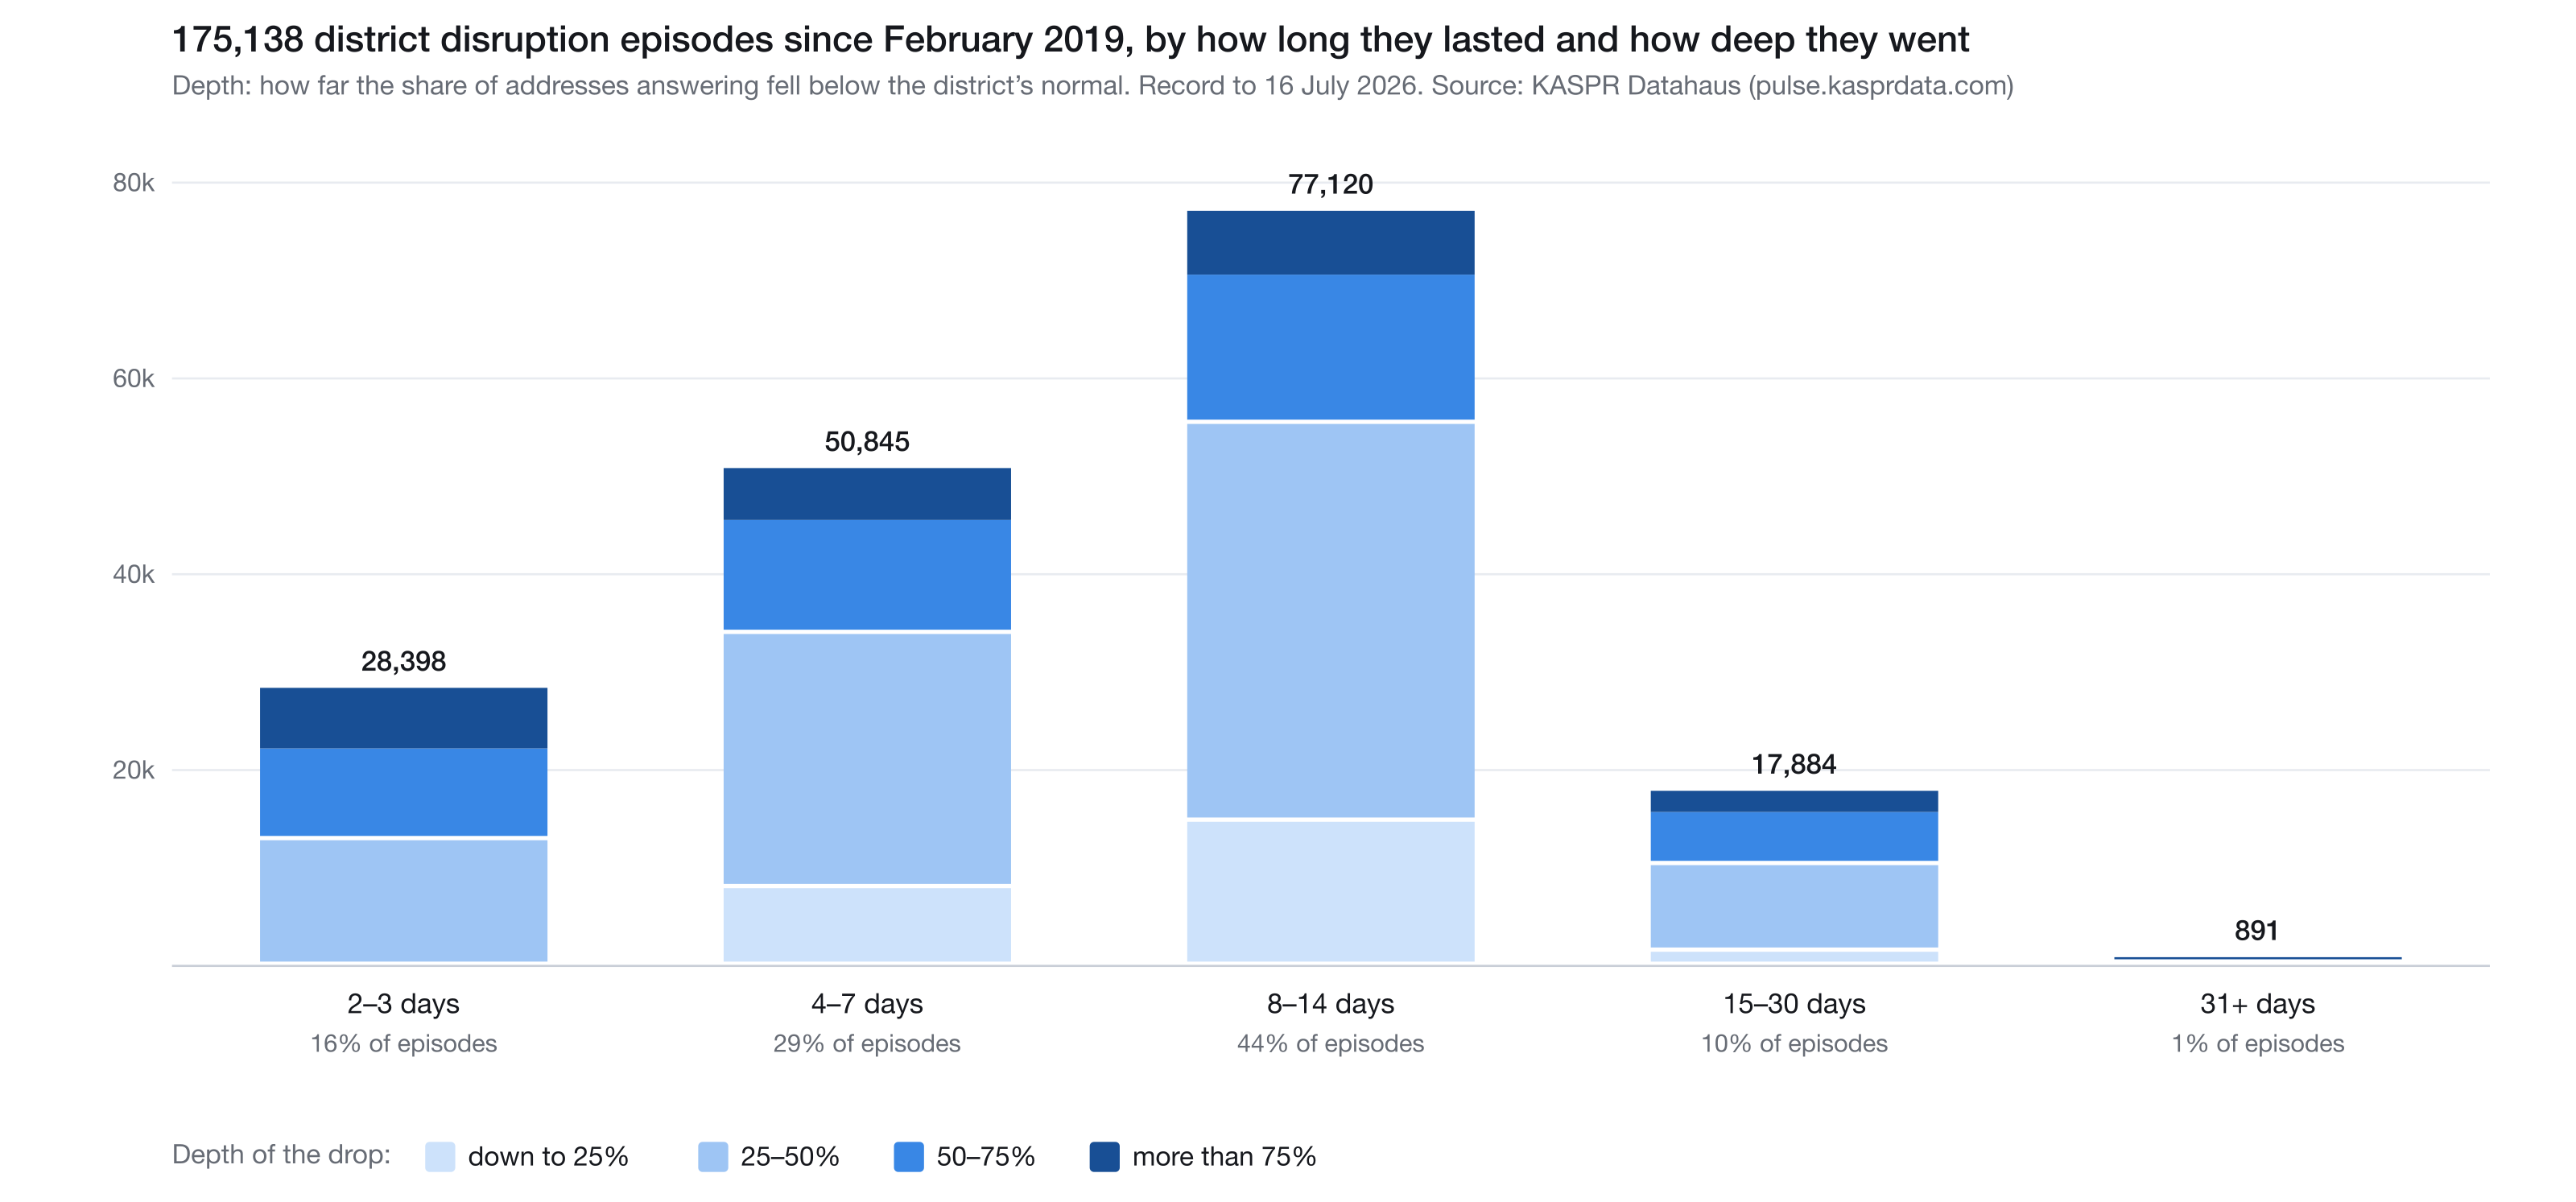 Figure 2. What a history of failures looks like. Every disruption episode KASPR has recorded in a district since February 2019, by how long it lasted and how far connectivity fell below the district’s normal. Most episodes last a week or two and take a quarter to a half of the district’s addresses offline; a few hundred ran for more than a month. Each one has a start, a depth and a recovery against which a model’s output can be checked. Source: KASPR Datahaus, record to 16 July 2026.
Network operators have detailed data on their own networks and very little on anyone else’s. Enterprises, insurers and governments usually have less. That gap is where most models of the connected world fall short.
What KASPR World provides
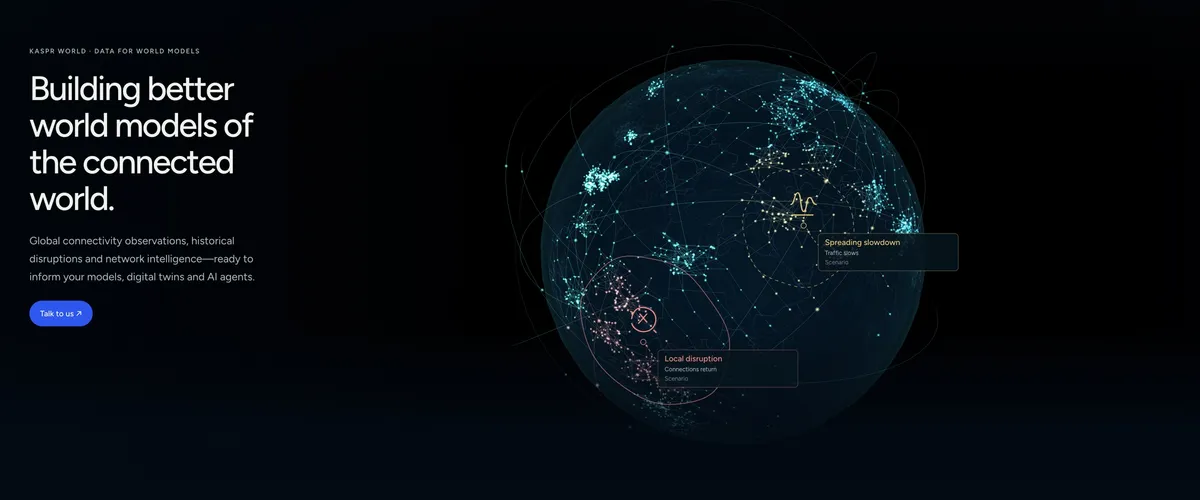
KASPR World is our data offering for world models, digital twins and AI agents. It is built on measurements we have taken since 2019. We probe more than 400 million internet endpoints every day, which adds about 3.5 billion observations a day to a record of more than 7.5 trillion data points. The data covers districts that are home to over 98% of the world’s population.
For each place the record shows connectivity, latency and stability over time, and every disruption episode, with its depth, its duration and how recovery went. It can be used in four ways:
- to ground a model or digital twin in observed conditions
- to test forecasts and scenarios against past disruptions and recoveries
- to combine with their own telemetry, asset lists and operational data
- to give AI agents network context through an API or our MCP connector
It is important to be clear about the limits. We supply observations, not a finished simulator. We measure the internet in places from the outside, so we do not see inside any company’s servers, and our data would not have predicted Thursday’s failure inside Microsoft. Our records show when and how deeply connectivity dropped. They do not show why. The data adds to a team’s internal telemetry and does not replace it.
Who this is for
Telecom and network infrastructure teams can test capacity and failure scenarios against conditions outside their own network. Insurers and infrastructure investors can model how losses accumulate across places. Enterprise resilience teams can rehearse the loss of a site or region. Governments can plan for the failure of national infrastructure. Developers of AI and autonomous systems can give their models a picture of the network they run on.
Thursday’s outage will be studied closely inside Microsoft. Everyone else can use it as a prompt to ask what their own model of failure is built on. If you are building one, tell us about your use case or read the data documentation.
Sources
- CNBC: Widespread Microsoft outage takes down Outlook and other 365 services
- Microsoft 365 Status on X
- Global News: Microsoft 365 outage continues globally
- iTnews: Microsoft users caught up in global M365 outage
- TechRadar live coverage
- Ericsson white paper: Telecom foundation world models, toward higher levels of network autonomy (5 August 2026)
- Amdocs blog: How AI-powered digital twins are driving autonomous telco networks (12 March 2025)
- TelecomTV: Amdocs on the journey to autonomous networks (23 September 2026)
- KASPR World
See also, on KASPR Pulse: What the Microsoft 365 outage does not tell you about a company’s digital risk, the same outage from the side of company risk.