Understanding how internet performance differs across Internet Service Providers (ISPs) and telecom operators is crucial for market analysis, infrastructure benchmarking, and policy development.
KASPR Datahaus continuously measures the connectivity and latency of millions of internet endpoints globally—enabling granular, hour-by-hour insights into how different providers perform within the same region or country.
Below we illustrate two examples of how KASPR’s ISP-level latency data can be used to benchmark network performance and stability.
Example 1: Comparing ISPs in the Philippines
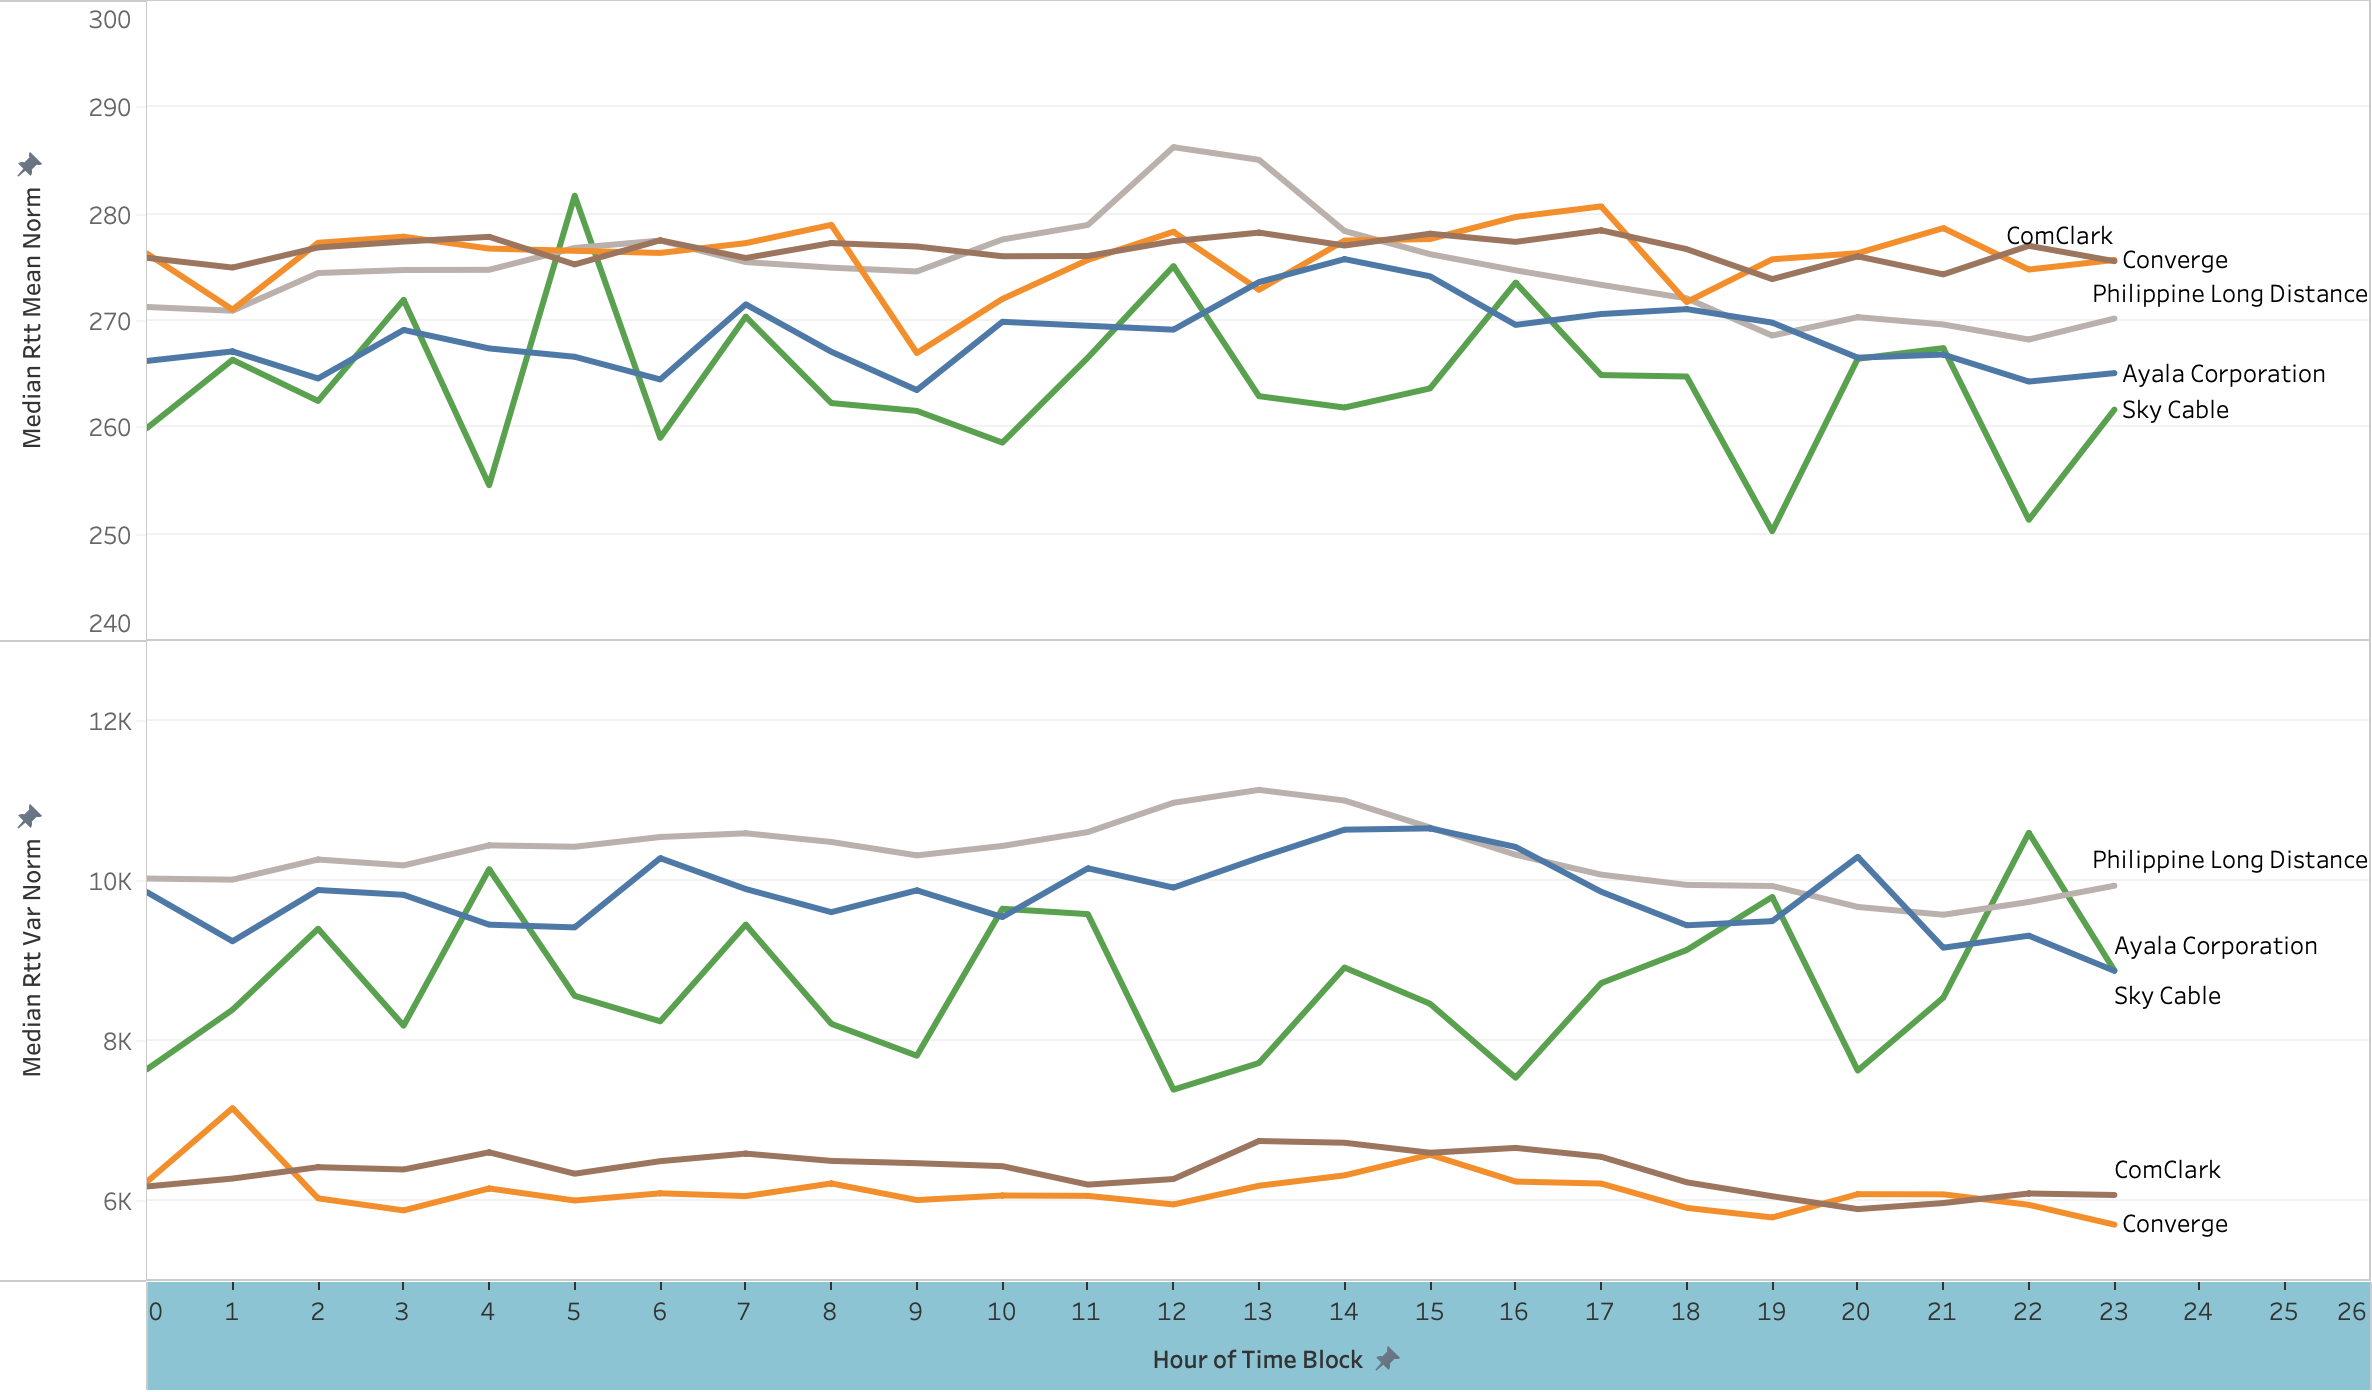
The first figure shows hourly internet performance by major ISPs in the Philippines.
The top panel plots the median normalized round-trip time (RTT Mean Norm), an indicator of average latency—how quickly data packets travel between users and servers.
The bottom panel shows variance in latency (RTT Var Norm), which reflects stability and network consistency.
A few key insights emerge:
- ComClark and Converge maintain the lowest latency values throughout the day, signaling strong network performance.
- Philippine Long Distance (PLDT) and Ayala Corporation show slightly higher average latencies, with Sky Cable exhibiting greater hour-to-hour variability.
- Variability (bottom chart) highlights which providers experience more congestion or instability during certain hours—critical information for assessing customer experience and planning peering or investment strategies.
Example 2: Telecom Providers in Regional Australia
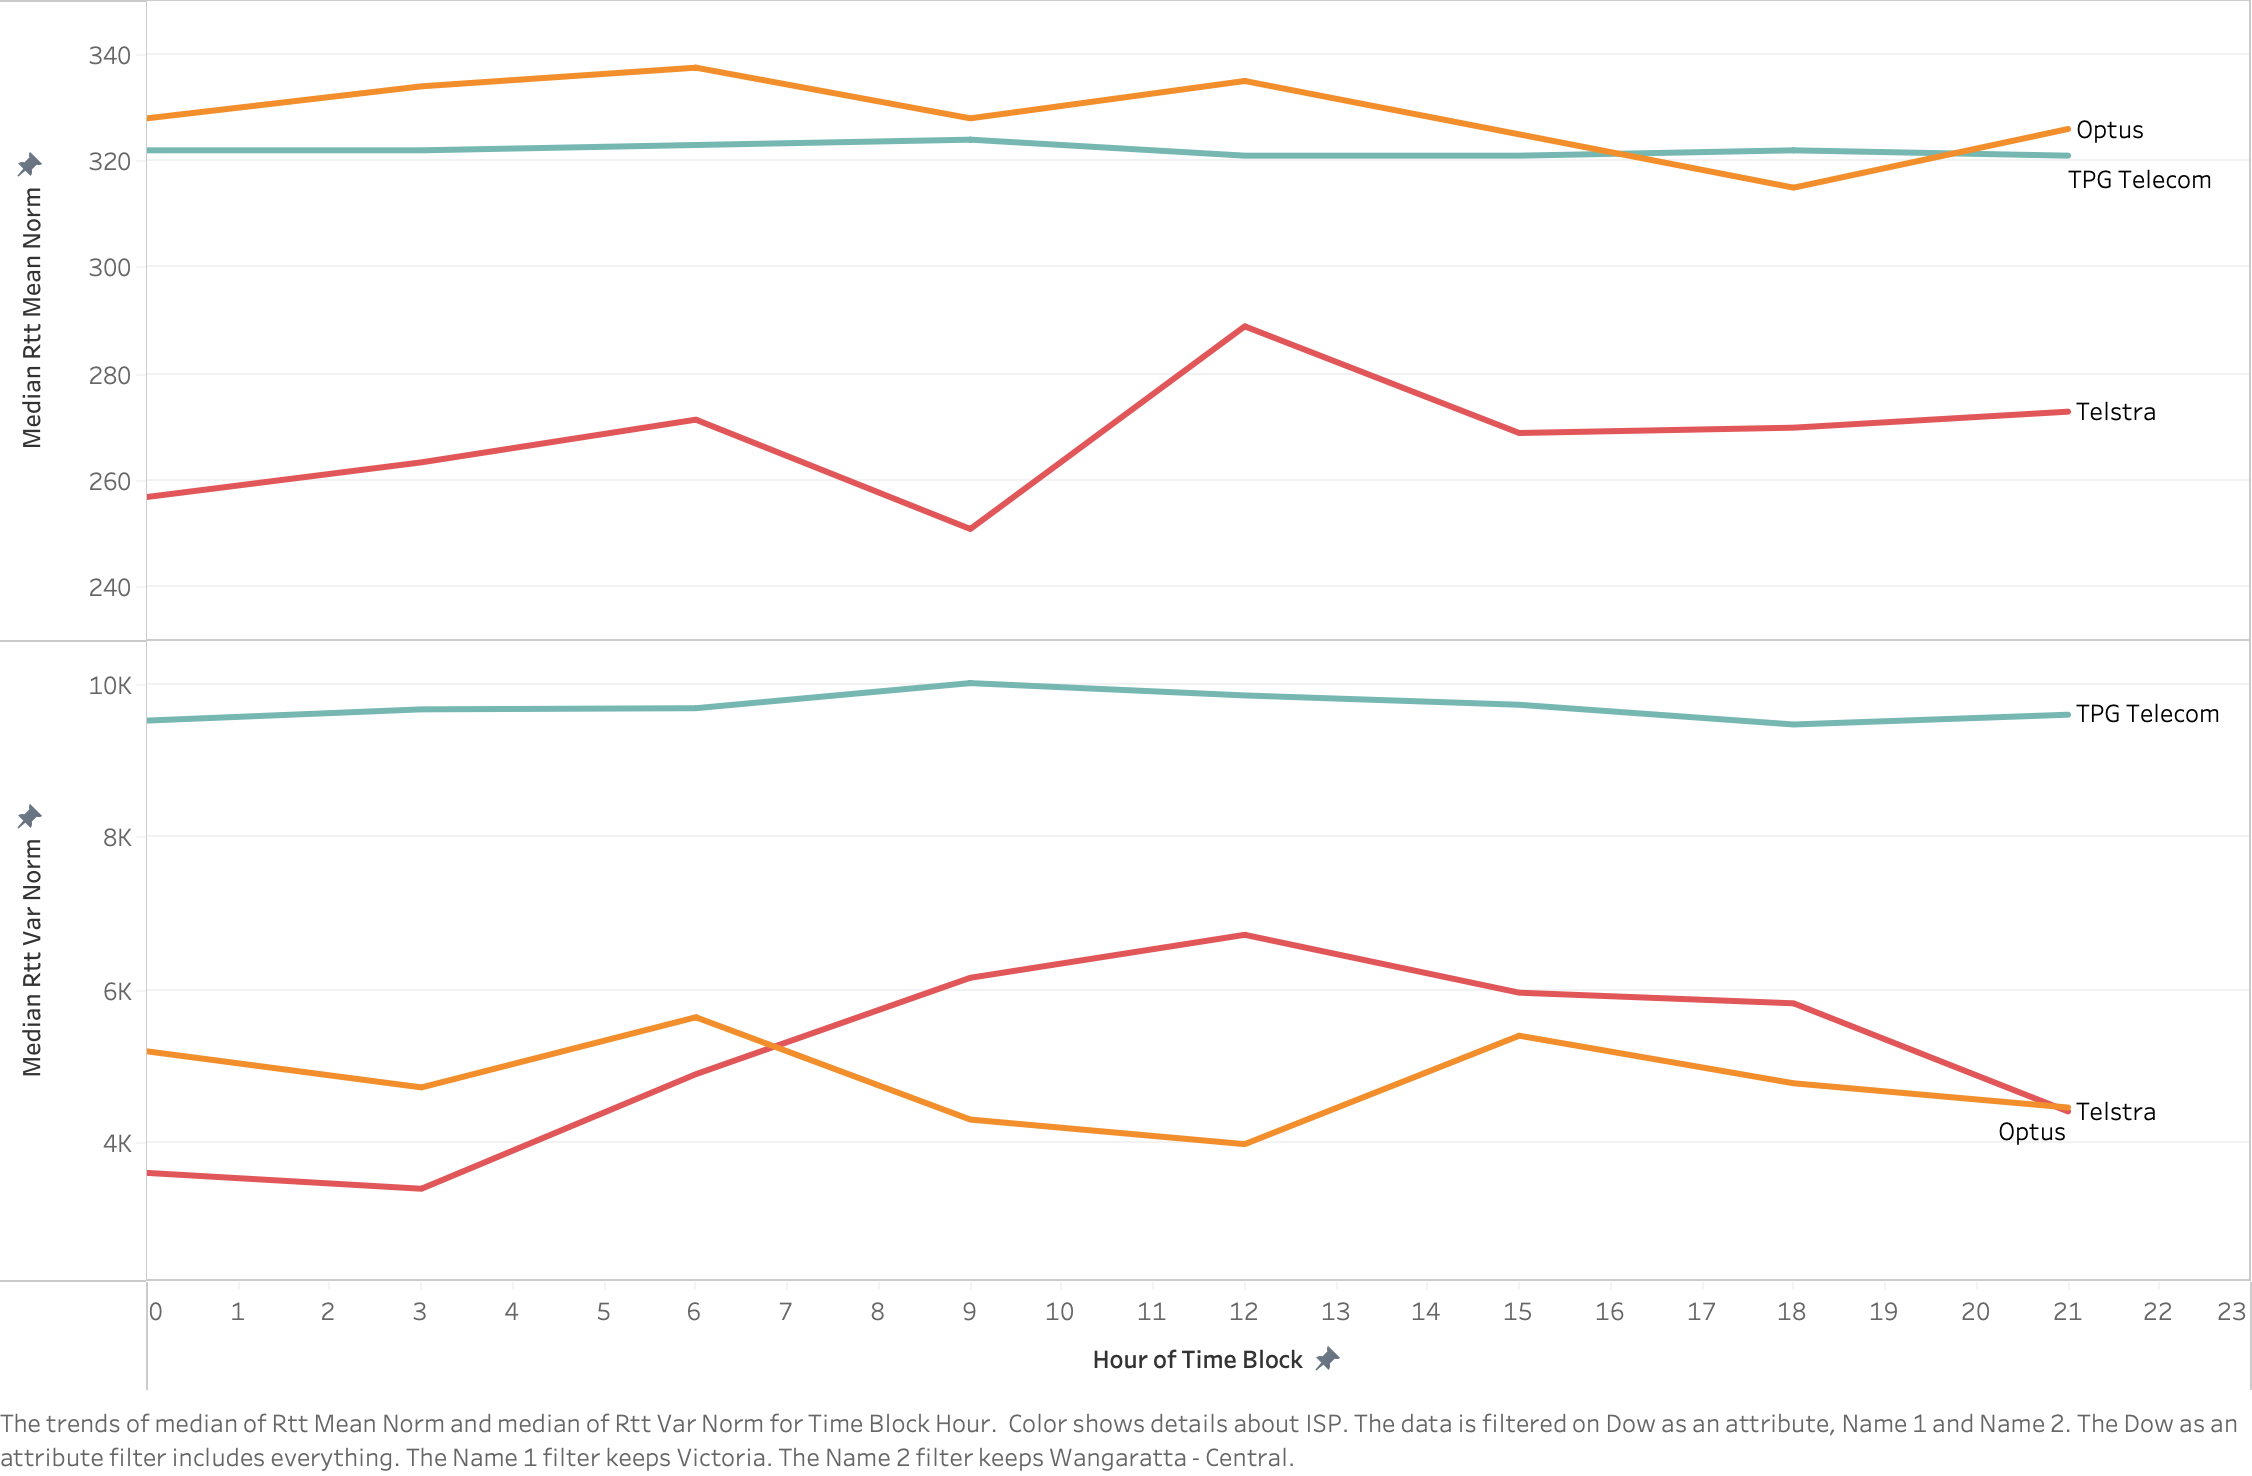
The second figure presents a similar comparison for a local government area in Victoria, Australia (Wangaratta–Central), where we benchmarked Optus, Telstra, and TPG Telecom.
- TPG Telecom shows consistently stable latency and the lowest variance across all hours—indicating reliable performance even during peak periods.
- Optus displays higher mean latency, while Telstra exhibits both higher average latency and greater variability, particularly around midday.
- This type of analysis allows both regulators and market participants to identify regional network performance differences and potential bottlenecks.
Why This Matters
With KASPR’s data, analysts, regulators, and network operators can:
- Benchmark ISPs and telcos across time, regions, and customer bases.
- Identify congestion patterns and periods of degraded service quality.
- Compare infrastructure resilience under different load conditions.
- Support competitive analysis and infrastructure investment planning.
By combining five years of historical data with real-time updates, KASPR Datahaus offers an unparalleled lens into the digital infrastructure that underpins modern economies.
Explore more:
Learn how KASPR Datahaus maps, monitors, and predicts global internet performance at kasprdatahaus.com