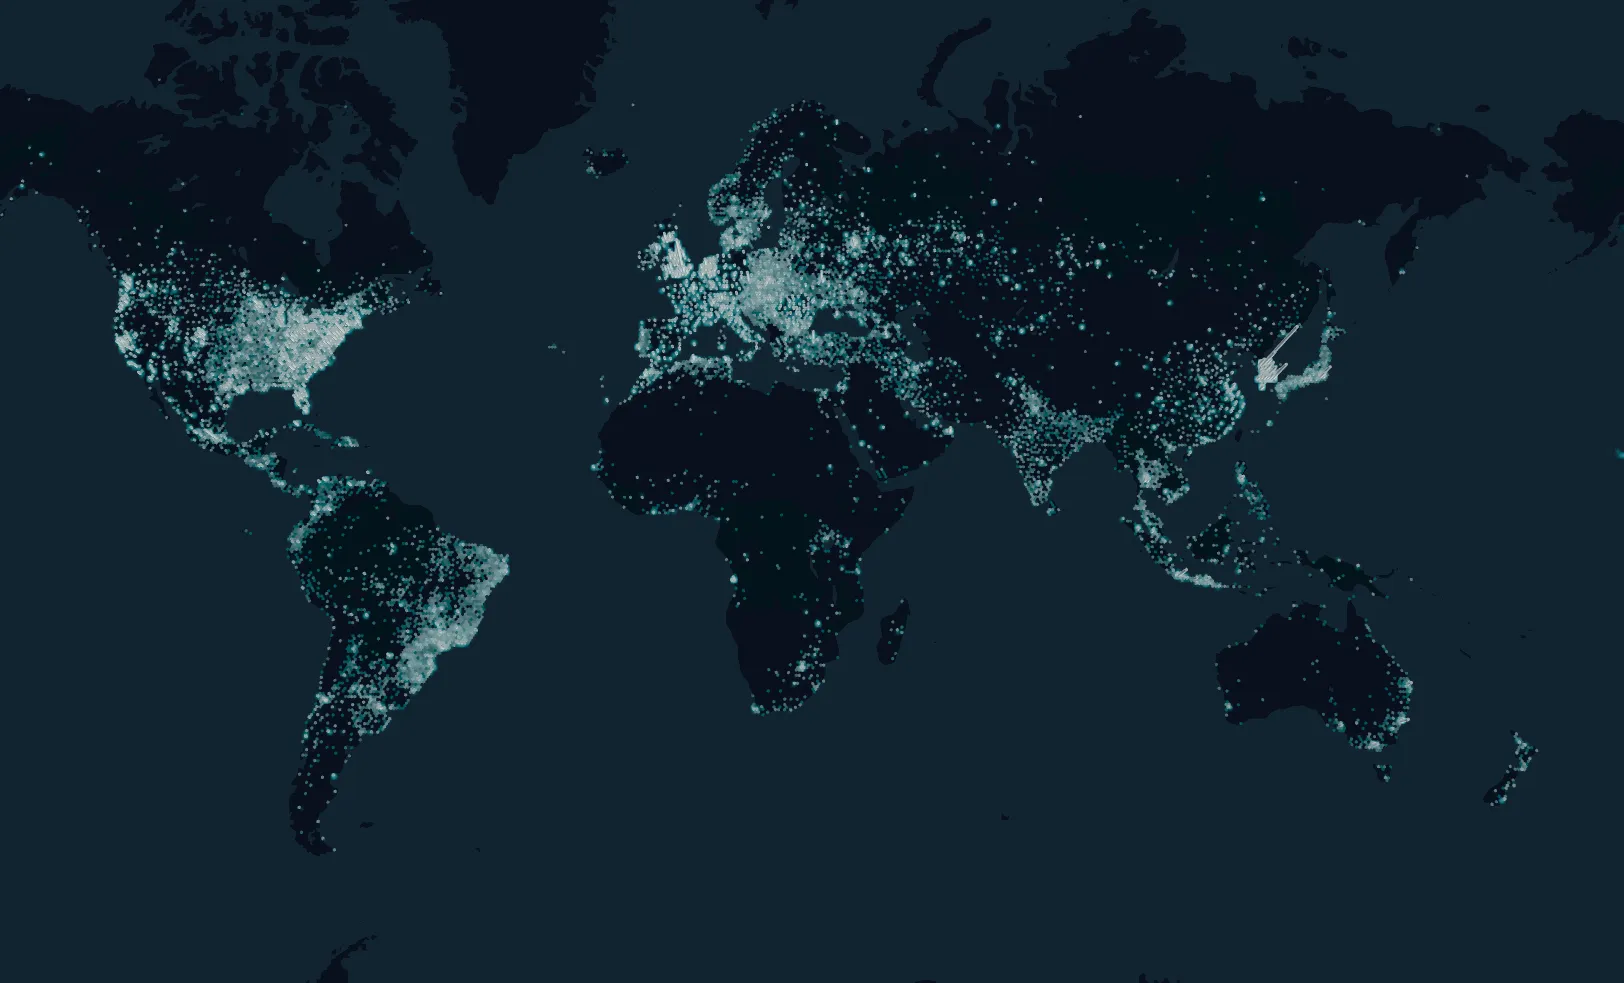
Access to reliable and fast internet is no longer a luxury—it is a basic requirement for participation in modern economic and social life. Yet, even within advanced economies, connectivity quality can vary sharply between neighborhoods, cities, and regions.
KASPR Datahaus provides a data-driven way to measure and monitor these disparities in real time. Our platform continuously collects and analyzes billions of connectivity and latency measurements across millions of fixed IP endpoints. This allows public agencies, telecom regulators, and infrastructure planners to identify where digital access falls behind and to track improvements over time.
Detecting Underserved Areas
Using KASPR’s high-frequency, geo-located data, we can pinpoint locations with systematically lower connection quality or persistent downtime. These signals are early indicators of areas that may be underserved or at risk of digital exclusion.
For example, the map below shows measured internet quality across Los Angeles. The spatial variation is evident—central areas perform well, while peripheral districts show higher latency and lower reliability.
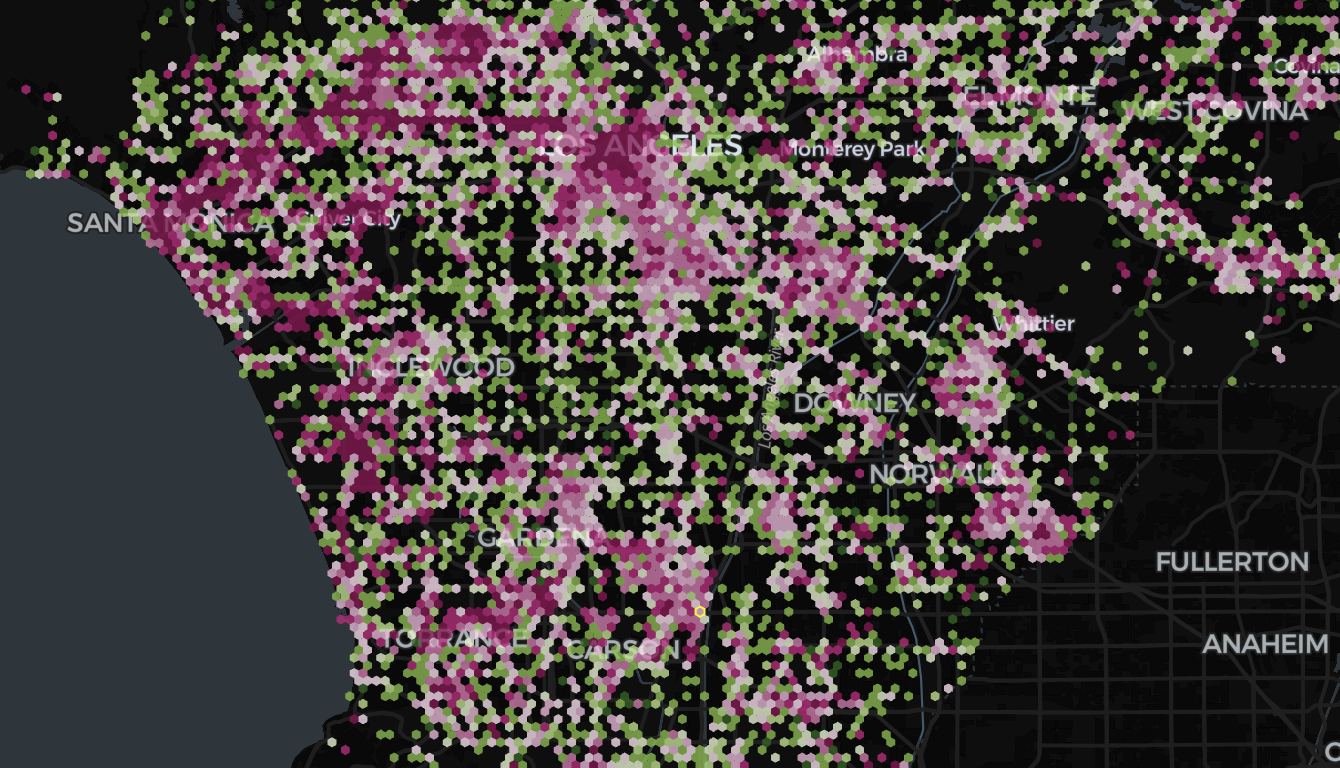
KASPR’s granular measurement approach enables decision-makers to go beyond averages and see the local detail. This is essential for targeted infrastructure investment, subsidy programs, and equitable rollout of high-speed connectivity.
Measuring Spatial Variations in Internet Quality
Spatial heterogeneity in internet performance often reflects differences in provider coverage, infrastructure age, and local demand. KASPR’s system captures these dynamics in real time, allowing comparisons not just across space, but across networks and providers.
The following example shows the distribution of service quality in Sydney, highlighting how performance differs even within a single metropolitan area.
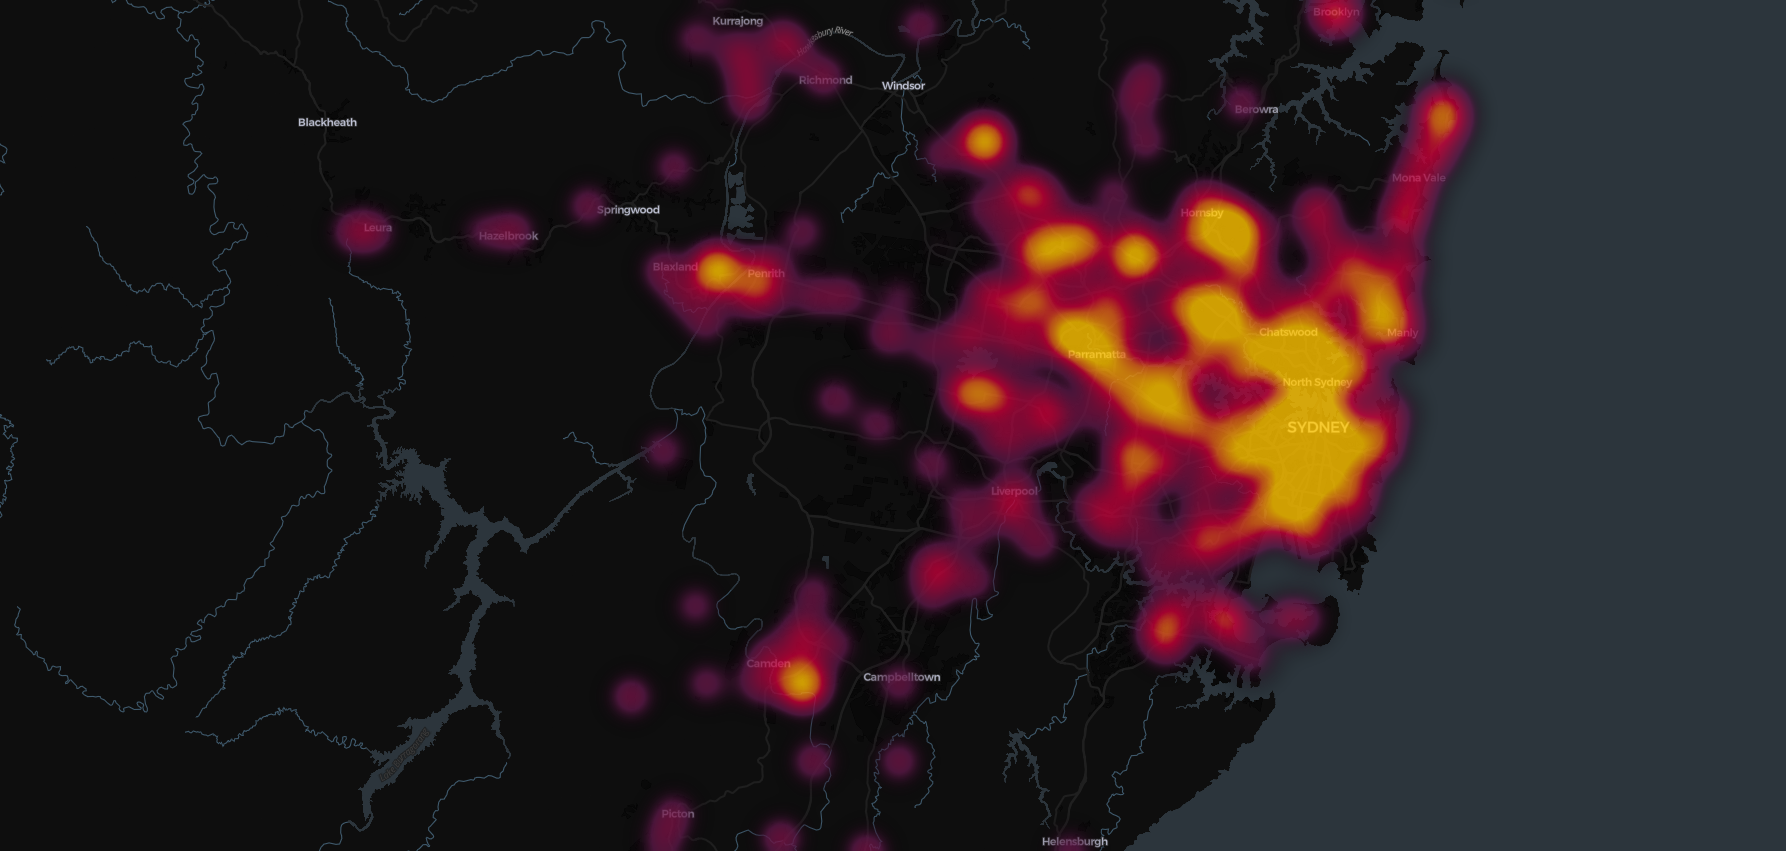
With this information, local authorities and telecommunications regulators can identify where service quality diverges most—whether between urban and rural areas, or within specific suburbs and districts.
Monitoring Progress Over Time
KASPR’s continuous data collection allows public-sector institutions to track improvements or declines in digital infrastructure over weeks, months, or years. This long-term perspective helps assess whether policy interventions or infrastructure investments are closing the gap—or whether disparities persist.
- Monthly and yearly reports can summarize connectivity changes at the national, state, or city level.
- Provider-level benchmarking highlights which networks improve fastest or lag behind.
- Before-and-after comparisons make it easy to evaluate the impact of new infrastructure projects or policy reforms.
From Measurement to Action
By offering a real-time, transparent view of digital performance, KASPR helps governments, regulators, and planners make informed decisions. The data can support:
- Broadband investment prioritization
- Rural connectivity initiatives
- Emergency communication planning
- Monitoring of digital inclusion goals
KASPR Datahaus provides the tools to see where the digital divide persists—and how to close it.
Through continuous, granular measurement, we help the public sector build a more connected and resilient digital future.