Case Study · Critical Infrastructure

The night Europe's largest nuclear plant went dark

At 08:05:43 on 4 March 2022, the last successful internet measurement reached the Zaporizhzhia Nuclear Power Plant. Every other network in the district stayed online. Scroll to see what that looked like in the data.

08:05:43 Last plant measurement · 4 Mar 2022
5.7 GW Installed capacity · 6 reactors
~20% Of Ukraine's electricity
53 hrs Until the district followed
Scroll to begin ↓
UKRAINE · ACTIVE MEASUREMENT GRID
47.5094°N   34.5858°E
01 — The Prelude

Every network leaves a trace

KASPR Datahaus probes millions of individual internet endpoints around the world, continuously, at high frequency. Ukraine in February 2022 was no exception: hundreds of thousands of addresses answering — or failing to answer — around the clock.

Each measurement is small. Taken together, they are a live map of which infrastructure is still functioning and which is not.

02 — The Location

Enerhodar, Zaporizhzhia Oblast

On the left bank of the Dnipro, 200 km upstream from the Black Sea, sits a purpose-built company town of 50,000 people. Its reason for existing is the facility on its northern edge.

Within the district's address space, one narrow block of IPs belongs to the plant itself. That separation is what makes the next twelve days legible.

03 — The Facility

Six reactors on the Dnipro

The Zaporizhzhia Nuclear Power Plant is the largest in Europe: six VVER-1000 reactors, 5.7 gigawatts, roughly a fifth of Ukraine's electricity.

In the early hours of 4 March 2022 it became the first operating nuclear power station in history to be captured by military force.

The Measurement Record

Twelve days of probes, one address block at a time

What follows is the raw measurement record for the Enerhodar district between 20 February and 7 March 2022. Nothing is smoothed, aggregated or modelled — every mark is a single probe that got an answer.

Active IP Measurements · Enerhodar District 20 Feb – 7 Mar 2022 · one mark = one answered probe
20-Feb-2022 00:00:00
01 — The Plant

Every ring is one answered probe inside the plant

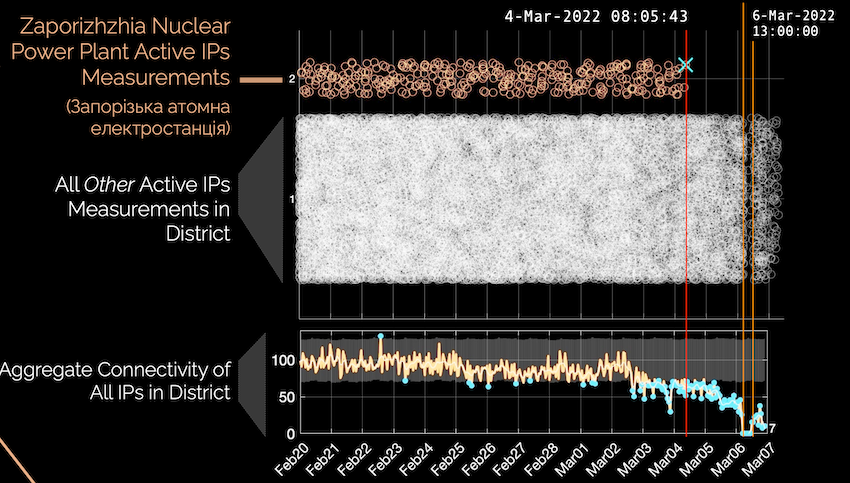
The upper band holds measurements to IP addresses in the Zaporizhzhia Nuclear Power Plant's own range — the facility's network, not the town's. Запорізька атомна електростанція.

The rhythm is unremarkable, which is the point. Day after day the plant answers, a few hundred successful probes per day, spread evenly across the clock. This is what normal looks like.

02 — The District

And every other address around it

Beneath the plant band, the same probes to every other active IP in the surrounding district — homes, businesses, the town of Enerhodar, roughly fourteen thousand endpoints answering continuously.

Two populations, one method, one window. Whatever happens next, we can ask a question that a single time series cannot answer: did it happen to the facility, or did it happen to the region?

03 — The Seizure
4 Mar 2022 · 08:05:43

The plant band stops. Nothing else does.

Russian forces took control of the site in the early hours of 4 March, after a night of shelling that set a training building alight. At 08:05:43 the last probe to a plant address came back. There was never another.

The white band carries straight through it. The town is still online, the district is still answering. The break is confined to one address block — a site-specific event, not a regional outage.

04 — The District Follows
6 Mar 2022 · 04:00 → 13:00

Fifty-three hours later, Enerhodar goes too

The district holds for two more days, then degrades and collapses. By 04:00 on 6 March the dense band has frayed to a scatter; by 13:00 almost nothing in the district answers at all.

The ordering matters. Had both failed together, this would read as a power or transit failure. Instead the facility went dark first and alone — and the region followed only once the occupation extended past the fence line.

05 — The Aggregate

The same story, as a single index

Underneath, aggregate connectivity for the whole district against its own historical expected range. It tracks inside that band for the first ten days, slips below it on 2 March, and falls to zero on 6 March.

This is the view an operations desk sees: one line, one threshold, an alert the moment it breaks. The scatter above is the evidence; the index is the trigger.
Reading the Signal

A digital observable for a physical event

The occupation of Zaporizhzhia was reported within hours. Most infrastructure shocks are not. What this record demonstrates is that the shock had a measurable digital signature — one that was available in real time, from outside the country, with no access to the site.

The diagnostic is the comparison, not the drop. A facility going quiet tells you very little on its own — networks fail constantly. A facility going quiet while its own neighbourhood keeps answering is a different claim entirely, and it is one you can make with confidence within minutes.

That distinction is what turns telemetry into intelligence. It rules out the mundane explanations — regional power loss, upstream transit failure, a submarine cable cut — and leaves the ones that matter.

The Method

How KASPR monitors critical infrastructure

01

Asset-level isolation

We resolve the IP ranges belonging to strategic assets — power stations, ports, data centres, refineries — and monitor them as named entities rather than as anonymous traffic.

  • Active IP counts
  • Latency and packet loss
  • Routing and reachability anomalies
02

Differential analysis

Every asset is scored against the region that surrounds it. The comparison separates a site-specific shock from a wider network event without waiting for confirmation on the ground.

  • Both fall → regional outage
  • Site falls alone → localised event
  • Region falls alone → infrastructure or transit
03

Real-time alerting

Deviation from an asset's own historical envelope raises an alert in minutes, delivered to the desks that need it — energy and utilities, government and defence, risk and insurance.

  • Per-asset thresholds
  • Sustained-deviation and step-change triggers
  • API, webhook or dashboard delivery
Original KASPR analysis of Zaporizhzhia NPP active IP measurements, February to March 2022
The original analysis. Upper band: active IP measurements within the plant's range. Middle: all other active IPs in the district. Lower: aggregate district connectivity against its historical expected range. Red line marks 4 Mar 2022 08:05:43; amber lines mark the district blackout on 6 Mar.
Data & Method

What sits behind the chart

A note on this page. The interactive chart above reproduces the shape and timing of the published analysis for narrative clarity; the underlying figure and its exact measurement counts are shown in full in the original plot. Access to the source series is available on request.

Why this matters beyond one plant

Zaporizhzhia is an extreme case, and that is what makes it a useful one: the ground truth is unambiguous and independently documented, so the digital signal can be checked against it. The same method applies wherever a physical asset has a network footprint.

A substation that stops answering while its feeder region does not. A port whose terminal operations network degrades hours before a berth closure is announced. A data centre whose reachability fractures ahead of any status-page update. In each case the question is the same, and so is the way you answer it.

Internet connectivity was for a long time treated as plumbing — technical, uninteresting, someone else's problem. It is better understood as a continuously updating record of which infrastructure is still working, available to anyone with the measurement capacity to collect it.

See it on your own assets

Tell us which facilities matter to you. We will show you what their digital footprint has looked like for the past twelve months — and what it looks like right now.

Request a Briefing More Case Studies →

KASPR Datahaus · Critical Infrastructure Monitoring. Analysis by Simon Angus.

Satellite imagery and event timeline reproduced for illustrative purposes. Event times in UTC.