Using real-time network data to safeguard connectivity in high‐stakes democratic events
1. Context: The Digital Dimension of Elections
Durinng the 2020 US election, internet-connected devices and networks became de facto infrastructure of democracy—used for information access, campaign communications, polling-station coordination and more.
2. Measurement Approach
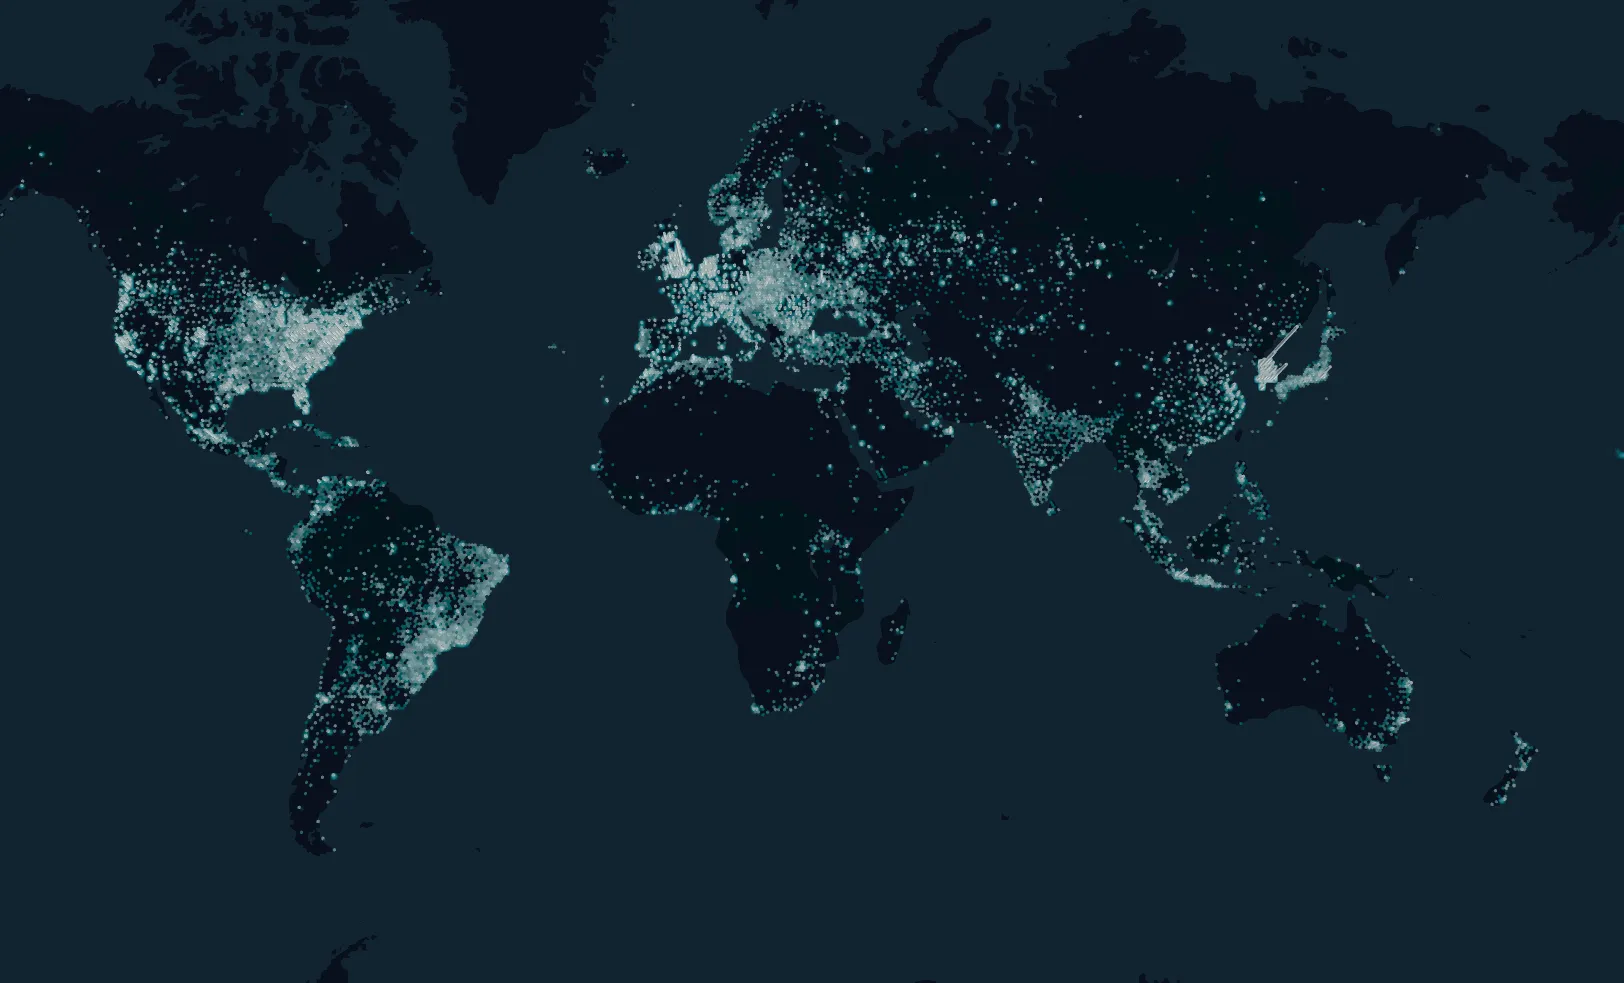
KASPR’s methodology aligns with that described by the Monash observatory: continuously sampling millions of IP endpoints globally, tracking uptime (online/offline), and measuring latency (round-trip time, RTT) as a proxy for network quality.
Key features include:
- Breadth of measurement: Over 21 million unique endpoints across 51 US states from 1–12 October 2020.
- Latency focus: The median value represents the “middle” user experience; the 99th percentile highlights the worst 1 % of end-users.
- Geo-based aggregation: Measurements are aggregated by state (or region) to illustrate spatial variation and identify vulnerable areas.
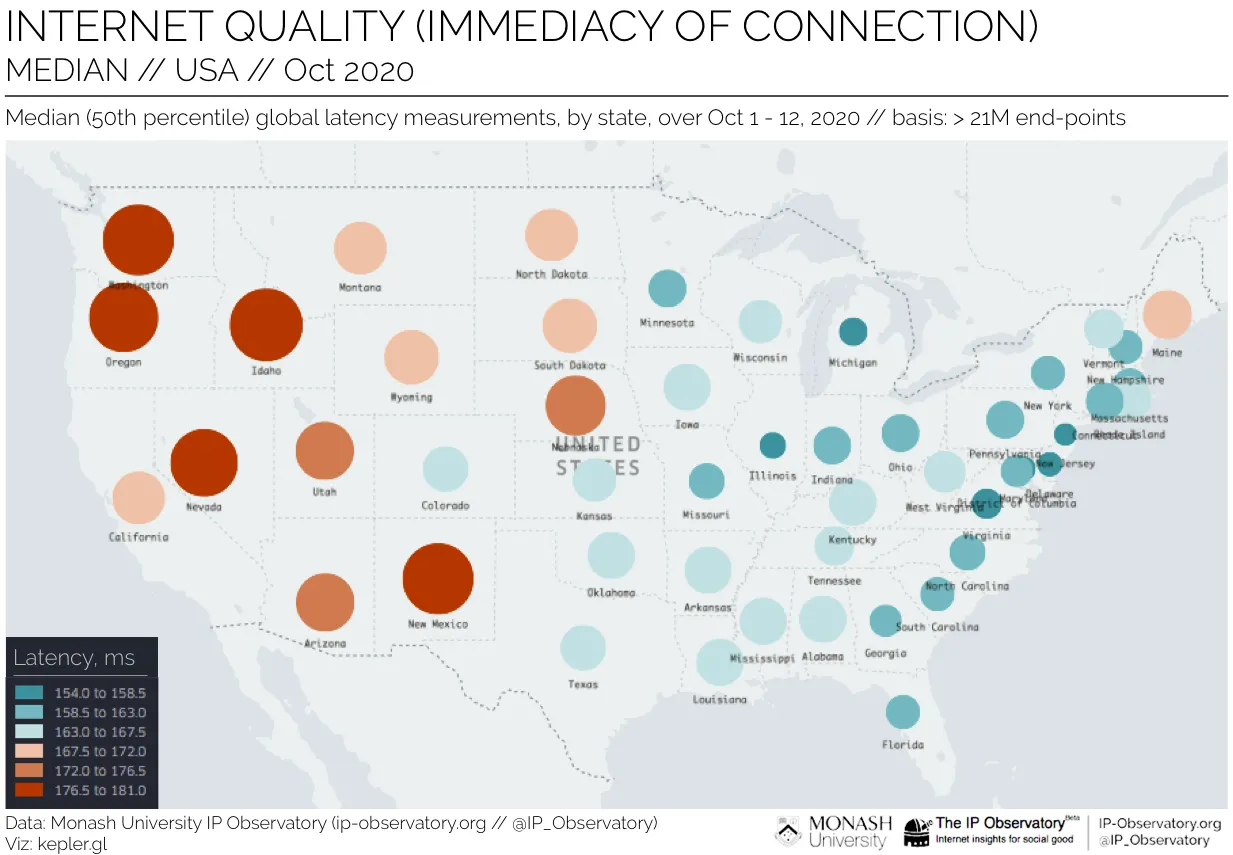
Source: Monash IP Observatory
The map shows that some states experienced 16% higher median latency than others—a signal that geographic disparity matters.
3. How KASPR Can Be Applied for Election-Ready Monitoring
Here’s how KASPR’s real-time, granular data platform can be leveraged in the context of elections:
a) Pre-election Baseline
By measuring network performance well ahead of polling day, KASPR can establish baseline metrics for connectivity and latency in each region or electoral district. Deviations from expected baseline during the event can be flagged as anomalies.
b) Real-time Monitoring During Voting
During election day and surrounding windows (early voting, absentee processing, live result feeds), KASPR can track:
- Uptime of critical service endpoints (e.g., electoral commission websites, polling-station networks)
- Latency spikes or routing degradation in specific states or districts
- Sudden loss of connectivity in key swing-locations or underserved regions
c) Post-event Review & Accountability
By comparing median vs 99th-percentile latency and coverage gaps, KASPR provides transparent indicators of network health and inclusivity—helping evaluate whether all citizens had equitable digital access. For example, the Monash study found that some states’ worst-1 % users experienced latency more than 100% slower than the best states.
This insight supports policy responses, infrastructure investment and electoral integrity audits.
4. Use Case Illustration
Consider a hypothetical country planning national elections. KASPR could:
- Map connectivity by region/province to highlight underserved districts before polls.
- During election week, issue early alerts if latency climbs significantly in a region expected to have high turnout.
- After voting, generate a report showing which regions had degraded performance, revealing possible digital exclusion zones.
In the US context, the Monash team highlighted states like Iowa and Oklahoma as having the worst-1 % user experiences (e.g., ~400 ms latency), which could materially affect real-time participation and information access.
With KASPR, similar patterns could be detected in other nations or regions.
Source: Monash IP Observatory
The gap between median and worst-1 % latency helps highlight which populations may be digitally disadvantaged in electoral processes.
5. Why This Matters for Digital Infrastructure and Democracy
- Equality of access: If a portion of the electorate is forced to contend with poor connectivity, their ability to access online campaigning, live election information or digital voting channels is impaired.
- Situational awareness: Real-time network monitoring provides election authorities with actionable intelligence—when, where and how connectivity problems arise.
- Transparency and trust: Public-sector bodies and election commissions gain quantitative, independent evidence of digital infrastructure performance, supporting trust and accountability.
- Policy readiness: Post-event data can inform strategic investment in underserved networks, reducing future risk of digital exclusion.
6. KASPR in Action: What We Offer
- High-frequency measurements at the IP-endpoint level, with geo-tagging and latency metrics.
- Visual mapping of median and worst-percentile performance across regions.
- Real-time alerting of connectivity anomalies during critical periods (e.g., election week).
- Historical dashboards to benchmark performance over time, assess infrastructure improvements or regressions.
By deploying KASPR’s monitoring platform in election-critical contexts, governments, regulators and civil-society organisations can gain early warning of network disruptions, identify spatial disparities in connectivity quality, and evaluate whether digital infrastructure supports equitable democratic participation.
For more information on integrating KASPR for election-ready network monitoring, please get in touch.